Sorry to bring this old topic up, but I have a similar issue. When starting an app in debugger, or any app in debug mode, first I get TWO (always) error messages in a row:
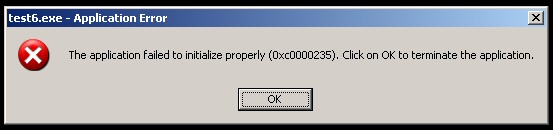
and then the debugger tells me
#0 7C964ED1 ntdll!RtlReAllocateHeap() (C:\WINDOWS\system32\ntdll.dll:??)
#1 7C93F8FB ntdll!RtlInsertElementGenericTableAvl() (C:\WINDOWS\system32\ntdll.dll:??)
#2 7C90EAC7 ntdll!LdrCreateOutOfProcessImage() (C:\WINDOWS\system32\ntdll.dll:??)
If I put gdb.exe in the app folder and drag the exe onto it, I get the RtlReAllocateHeap error. But when I do the same in my gf's computer, all works as expected. So, something must be totally messed up in mine.
The thing is, a simple console "Hello world" works fine in the debugger, but as soon as the app has to get ANYTHING from an external dll, it crashes in debug mode. Even an additional line of SDL_Init(SDL_INIT_VIDEO | SDL_INIT_AUDIO | SDL_INIT_TIMER); is enough to throw the RtlReAllocateHeap error when starting the debugger.
Everything is working in release mode, as well in the debug mode a few days ago. I don't think I have changed anything in the system lately .. So, have you guys got any ideas what it could be? As a last resort, I'm thinking of re-installing Windows, in case there's something messed up internally. Maybe the ntdll.dll is somehow broken, though the file size is exactly as it should be, so I don't think it's been modified.
Thanks in advance,
Eigen


