Author Topic: Running debugger on custom Makefile based project  (Read 16606 times)

Offline Wyrm

  • Multiple posting newcomer
  • *
  • Posts: 23
Running debugger on custom Makefile based project
« on: November 08, 2010, 07:11:32 am »
I would greatly appreciate anyone's help on this.

I have a large project (LLVM+Clang compiler) that I would like to debug in CB. LLVM/Clang is an open source compiler and you can find info online. I am COMPILING this compiler with g++ not running it from under CB. The source code of LLVM/Clang, like many other projects, relies on standard Linux configure+make utilities to build. I have loaded the files into CB, set the custom Makefile to be used for compilation. CB seems to have successfully compiled it and generated the Clang binaries.

However, I can not get the debugger to run the output executable. For the custom Makefile to work I had to set target to "all". Otherwise, makefile wouldn't recognize the target. However, CB seems to expect the target to be the output executable in order to launch the debugger (gdb).

I've looked through the user guide and browsed help online but I can't seem to find it how to configure the debugger to run the output executable (different from the target) with my command line options.

Thanks for your help.

Offline Jenna

  • Administrator
  • Lives here!
  • *****
  • Posts: 7255
Re: Running debugger on custom Makefile based project
« Reply #1 on: November 08, 2010, 07:40:38 am »
Did you change "Project -> Properties -> Build targets -> [the debug target] -> Output filename" to the executables name and path ?
Also take care that the "Execution working dir:" is set correctly and the both "Auto-generate filename ..." checkboxes are unchecked.

Offline Wyrm

  • Multiple posting newcomer
  • *
  • Posts: 23
Re: Running debugger on custom Makefile based project
« Reply #2 on: November 08, 2010, 08:08:24 am »
Did you change "Project -> Properties -> Build targets -> [the debug target] -> Output filename" to the executables name and path ?
Also take care that the "Execution working dir:" is set correctly and the both "Auto-generate filename ..." checkboxes are unchecked.

Yes I did set those. When I click Debug->Start CB does a successful rebuild and prints the following in the "Debugger" window:

Building to ensure sources are up-to-date
Build succeeded
Selecting target:
all
Adding source dir: /home/project/codeblocks/llvm/
Adding source dir: /home/project/codeblocks/


After that nothing is happening. Debug->"Stop Debugger" is inactive while Debug->Start remains active.
I have put a printf() with a breakpoint right at the start of main(). However, the debugger seems to do nothing. It doesn't appear to be launching the binary with gdb. Gdb is installed - I can run the generated binary through gdb in the standalone console, but can not get CB to run it. It just ignores me.

Any other ideas of what could go wrong? Does it require the target to be named "Debug"?


Offline Jenna

  • Administrator
  • Lives here!
  • *****
  • Posts: 7255
Re: Running debugger on custom Makefile based project
« Reply #3 on: November 08, 2010, 08:14:31 am »
Please check "Settings -> Compiler and debugger... -> Debugger settings -> Display debuggers's log" and post the content of the "Debugger (debug)" log.
And please put it in code-tags (to be created wth the hash-sign).

Offline Wyrm

  • Multiple posting newcomer
  • *
  • Posts: 23
Re: Running debugger on custom Makefile based project
« Reply #4 on: November 08, 2010, 08:21:51 am »
Please check "Settings -> Compiler and debugger... -> Debugger settings -> Display debuggers's log" and post the content of the "Debugger (debug)" log.
And please put it in code-tags (to be created wth the hash-sign).

Unfortunately, "Debugger (debug)" log opens up but stays blank, so the log is not very helpful either.

Offline Wyrm

  • Multiple posting newcomer
  • *
  • Posts: 23
Re: Running debugger on custom Makefile based project
« Reply #5 on: November 08, 2010, 08:24:26 am »
Jens, I may probably need to reinstall CB. I've created a small "hello world" test project and the debugger doesn't run there either. I must have screwed up some of the settings when I was recklessly turning various flags on and off. Will keep you updated if the clean reinstall fixes the problem. Thanks for your help.
« Last Edit: November 08, 2010, 08:58:16 am by Wyrm »

Offline Jenna

  • Administrator
  • Lives here!
  • *****
  • Posts: 7255
Re: Running debugger on custom Makefile based project
« Reply #6 on: November 08, 2010, 09:09:21 am »
Jens, I may probably need to reinstall CB. I've created a small "hello world" test project and the debugger doesn't run there either. I must have screwed up some of the settings when I was recklessly turning various flags on and off. Will keep you updated if the clean reinstall fixes the problem. Thanks for your help.

The reinstall will not delete your settings-file.
You can rename it (a new one will be created from scratch) to see if it helps.
The default configuration is stored in ~/.codeblocks/default.conf.

Offline oBFusCATed

  • Developer
  • Lives here!
  • *****
  • Posts: 13413
    • Travis build status
Re: Running debugger on custom Makefile based project
« Reply #7 on: November 08, 2010, 10:19:48 am »
BTW: You don't have to use target "all", because you can modify the arguments for make in the project options. It is in the last tab and on most linuxes it is hidden.

Also you can try the debuggers branch. I've tested simple makefile project and debugging was working. If not I will make it work.
(most of the time I ignore long posts)
[strangers don't send me private messages, I'll ignore them; post a topic in the forum, but first read the rules!]

Offline Wyrm

  • Multiple posting newcomer
  • *
  • Posts: 23
Re: Running debugger on custom Makefile based project
« Reply #8 on: November 10, 2010, 05:40:27 am »
Jens and Ob,

I have been able to fix the debugger problem. The problem was that I had set the application type to "Native" in Project->Properties->Build Targets->Type. With "Console application" type the debugger started working alright.

What is the difference between "Console application" type and "Native" type? I thought that Native meant the output binary would to be generated in the assembly native to the CPU.

It is also not clear why the debugger doesn't work when "Native" type is activated. At least it would be great if the debugger warned about an invalid application type instead of just ignoring me.

Thanks.

Offline Wyrm

  • Multiple posting newcomer
  • *
  • Posts: 23
Re: Running debugger on custom Makefile based project
« Reply #9 on: November 10, 2010, 08:29:53 am »
I have used the CB IDE for a little while now and would like to share my thoughts on it from the user's perspective. I am not sure if you are interested in users' feedback. If not, please discard my message.

Note also that I am not a GUI/graphics guy. I am more of a Vim+Makefile+Grep kinda guy (a dinosaur by today's standards). Since you guys are experts in GUIs and graphics I apologize in advance if my views are incorrect from the perspective of the modern GUI design. Before going forward, I would also like to emphasize that I appreciate the great work you've done (and still doing) on the IDE. And my comments are not intended to be viewed as criticism but rather suggestions for you to consider and possibly throw away if they do not make sense.

What has attracted me most to your IDE:

(1) Visual debugger.

(2) Nice and familiar layout and menus. I have worked with VC++ before and your IDE looked 50% familiar the moment I started it up. This is a very attractive trait from the user's perspective to feel familiar with the tool the first time they see it. I am not sure if that was the intent but it is great.

(3) Makefile handling. This is very important to me not to be locked into the IDE's internal files.

Some other features that I am definitely interested:

(4) The ability to run CB from the command line. This is needed for overnight regression tests.

(5) Generation of makefiles from CB's project files. My understanding is that this feature is not available at the moment. There may be lots of reasons why you would not want to enable it. I will not go into the discussion of pros and cons. However, from my perspective it would be a strong feature even if the output makefiles are not fully compatible with every single Linux distro.

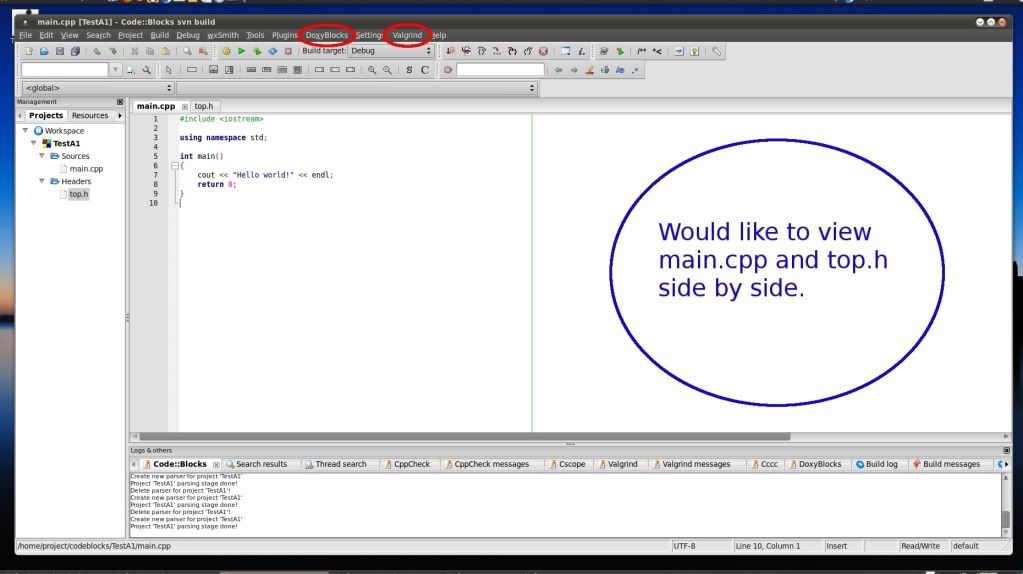
(6) The IDE does not allow to open 2 different files side by side, please see the screenshot attached at the bottom of this message. Notice that on a 16:9 widescreen monitor 1/2 of the space is dead space. The dead space can nicely fit another 80-character file. It is often convenient to have the class header and the implementation file open side by side and modified at the same time. Since IDE does not support it I will use another test editor but it is a bit strange to use IDE that way. Another possible use for the side by side view is running a diff on different versions of the same file.

(7) Bookmarks work only on the same file. The problem is that you often need to jump from a function call to its definition located in a different file. In the current implementation bookmarks do not allow this.

General thoughts:

(8 ) Feature creep. At first, I had installed and worked the latest CB version 8.02 that comes with Ubuntu Lucid. Now I installed the latest CB version 10.05 and noticed the new menu items for Doxygen and Valgrind. While these tools are useful, wouldn't it be more intuitive to put them in Tools menu (which is now nearly empty)? Please, see the red ellipses highlighting the top menu items in the screenshot. The same idea applies to wxSmith item. I am afraid as you go along adding new features and integrating new tools (e.g. a version control system) the CB environment will bloat into something resembling the heavy-weight KDevelop IDE. Not only will it require substantial maintenance effort from your team, the IDE will be dependent on quirks of multiple external tools, will age as those tools age, and porting to new Linux versions will get slower and slower. I am not sure how to address this problem but I would not want to use bloated IDEs like KDevelop and Eclipse. Is it possible to create some sort of a common interface to various command line tools (gprof, valgrind, doxygen, cvs/svn/git, diff, etc) to make sure that they are easy to UNplug when they are not needed?

Thanks!


Offline oBFusCATed

  • Developer
  • Lives here!
  • *****
  • Posts: 13413
    • Travis build status
Re: Running debugger on custom Makefile based project
« Reply #10 on: November 10, 2010, 09:17:06 am »
It is also not clear why the debugger doesn't work when "Native" type is activated. At least it would be great if the debugger warned about an invalid application type instead of just ignoring me.
Should be fixed in the debuggers branch...

Answers to the second post:
4. You can run it from the command line, but X11 is a required
5. No one has done it reliably, you can look at cbMakefileGen plugin
6. It does, grab the tab and drag it to the side
8. DoxyBlocks and Valgrind are plugins and the could be disabled, Plugins -> Manage or during compile time.
(most of the time I ignore long posts)
[strangers don't send me private messages, I'll ignore them; post a topic in the forum, but first read the rules!]

Offline Wyrm

  • Multiple posting newcomer
  • *
  • Posts: 23
Re: Running debugger on custom Makefile based project
« Reply #11 on: November 14, 2010, 09:58:39 am »
It is also not clear why the debugger doesn't work when "Native" type is activated. At least it would be great if the debugger warned about an invalid application type instead of just ignoring me.
Should be fixed in the debuggers branch...

Answers to the second post:
4. You can run it from the command line, but X11 is a required
5. No one has done it reliably, you can look at cbMakefileGen plugin
6. It does, grab the tab and drag it to the side
8. DoxyBlocks and Valgrind are plugins and the could be disabled, Plugins -> Manage or during compile time.

I have compiled CB from the debuggers branch. Gdb runs alright indeed even when the target type is set to "Native". Does the CB development team have any plans to merge the debuggers branch with the main one?

Regarding the other items:
(6) I was grabbing the file from the Project tab on the left instead of pulling the tab itself. Now I am able to put multiple files side by side as I wanted.
(7) The bookmarks are not that important now. I noticed that the newer version of CB has "Find declaration of" and "Find implementation of" options when you right click on a function or a variable name. That's good enough for me.
(8 ) I have turned off the plugins that I don't need. It turned out to be that easy!

Thanks for your help!

Offline Thor_89

  • Single posting newcomer
  • *
  • Posts: 2
Re: Running debugger on custom Makefile based project
« Reply #12 on: July 27, 2012, 02:30:38 pm »
Hello

I have similar problem with running debugger, while I'm using my Makefile. Project is build successfully and I can run it. But when i try to debug, debugger ignore my breakpoints and finish (status 0).

I have unchecked "Auto-generate ..." boxes (like you said before) and set Execution working dir to "." .

There is log from "Debugger (debug)" window:

Code
Command-line: C:\Program Files (x86)\CodeBlocks\MinGW\bin\gdb.exe -nx -fullname  -quiet -args bin/Debug/pokus.exe
Working dir : C:\Users\Thor\Desktop\pokus\
> set prompt >>>>>>cb_gdb:
(gdb) >>>>>>cb_gdb:
> show version
GNU gdb 6.8
Copyright (C) 2008 Free Software Foundation, Inc.
License GPLv3+: GNU GPL version 3 or later <http://gnu.org/licenses/gpl.html>
This is free software: you are free to change and redistribute it.
There is NO WARRANTY, to the extent permitted by law.  Type "show copying"
and "show warranty" for details.
This GDB was configured as "i686-pc-mingw32".
>>>>>>cb_gdb:
> set confirm off
>>>>>>cb_gdb:
> set width 0
>>>>>>cb_gdb:
> set height 0
>>>>>>cb_gdb:
> set breakpoint pending on
>>>>>>cb_gdb:
> set print asm-demangle on
>>>>>>cb_gdb:
> set unwindonsignal on
>>>>>>cb_gdb:
> set debugevents on
>>>>>>cb_gdb:
> set new-console on
>>>>>>cb_gdb:
> set disassembly-flavor att
>>>>>>cb_gdb:
> catch throw
Catchpoint 1 (throw)
>>>>>>cb_gdb:
> source C:\Program Files (x86)\CodeBlocks\share\codeblocks/scripts/stl-views-1.0.3.gdb
>>>>>>cb_gdb:
> directory C:/Users/Thor/Desktop/pokus/
>>>>>>cb_gdb:
> break "C:/Users/Thor/Desktop/pokus/main.cpp:13"
No source file named C:/Users/Thor/Desktop/pokus/main.cpp in loaded symbols.
Breakpoint 2 ("C:/Users/Thor/Desktop/pokus/main.cpp:13) pending.
>>>>>>cb_gdb:
> break "C:/Users/Thor/Desktop/pokus/main.cpp:12"
No source file named C:/Users/Thor/Desktop/pokus/main.cpp in loaded symbols.
Breakpoint 3 ("C:/Users/Thor/Desktop/pokus/main.cpp:12) pending.
>>>>>>cb_gdb:
> break "C:/Users/Thor/Desktop/pokus/main.cpp:11"
No source file named C:/Users/Thor/Desktop/pokus/main.cpp in loaded symbols.
Breakpoint 4 ("C:/Users/Thor/Desktop/pokus/main.cpp:11) pending.
>>>>>>cb_gdb:
> break "C:/Users/Thor/Desktop/pokus/main.cpp:10"
No source file named C:/Users/Thor/Desktop/pokus/main.cpp in loaded symbols.
Breakpoint 5 ("C:/Users/Thor/Desktop/pokus/main.cpp:10) pending.
>>>>>>cb_gdb:
> break "C:/Users/Thor/Desktop/pokus/main.cpp:8"
No source file named C:/Users/Thor/Desktop/pokus/main.cpp in loaded symbols.
Breakpoint 6 ("C:/Users/Thor/Desktop/pokus/main.cpp:8) pending.
>>>>>>cb_gdb:
> break "C:/Users/Thor/Desktop/pokus/main.cpp:9"
No source file named C:/Users/Thor/Desktop/pokus/main.cpp in loaded symbols.
Breakpoint 7 ("C:/Users/Thor/Desktop/pokus/main.cpp:9) pending.
>>>>>>cb_gdb:
> break "C:/Users/Thor/Desktop/pokus/main.cpp:7"
No source file named C:/Users/Thor/Desktop/pokus/main.cpp in loaded symbols.
Breakpoint 8 ("C:/Users/Thor/Desktop/pokus/main.cpp:7) pending.
>>>>>>cb_gdb:
> break "C:/Users/Thor/Desktop/pokus/main.cpp:6"
No source file named C:/Users/Thor/Desktop/pokus/main.cpp in loaded symbols.
Breakpoint 9 ("C:/Users/Thor/Desktop/pokus/main.cpp:6) pending.
>>>>>>cb_gdb:
> run
gdb: win32_init_thread_list
[New thread 4904.0x1040]
Error: dll starting at 0x77200000 not found.
Error: dll starting at 0x753c0000 not found.
Error: dll starting at 0x77200000 not found.
Error: dll starting at 0x777e0000 not found.
Program exited normally.
>>>>>>cb_gdb:
> set debugevents off
>>>>>>cb_gdb:
> quit

It's a simple "Hello World!" project named "pokus" with one .cpp file (main.cpp).

Sorry for my english, I hope that you will follow.

Offline Jenna

  • Administrator
  • Lives here!
  • *****
  • Posts: 7255
Re: Running debugger on custom Makefile based project
« Reply #13 on: July 27, 2012, 02:37:22 pm »
Are you sure the Makefile produces debugging symbols (option -g set) and does not strip the binary ?

Offline Thor_89

  • Single posting newcomer
  • *
  • Posts: 2
Re: Running debugger on custom Makefile based project
« Reply #14 on: July 27, 2012, 03:47:37 pm »
Oh man!

Thanks a lot! ... -g solved my problem.

Stupid mistake of mine .. I suppose.  :-[